The Insights Reports
Insights has nine sets of reports that provide data on your connected devices. When you first sign in, the Overview Report displays by default. Use the left navigation panel to open the reports (refer to the example of this panel in the Accessing Insights section). If you are interested in using the Advanced Reports, contact your Ayla representative to obtain access. All nine sets of reports are described in this section of the Ayla Insights feature guide.
The Overview Reports
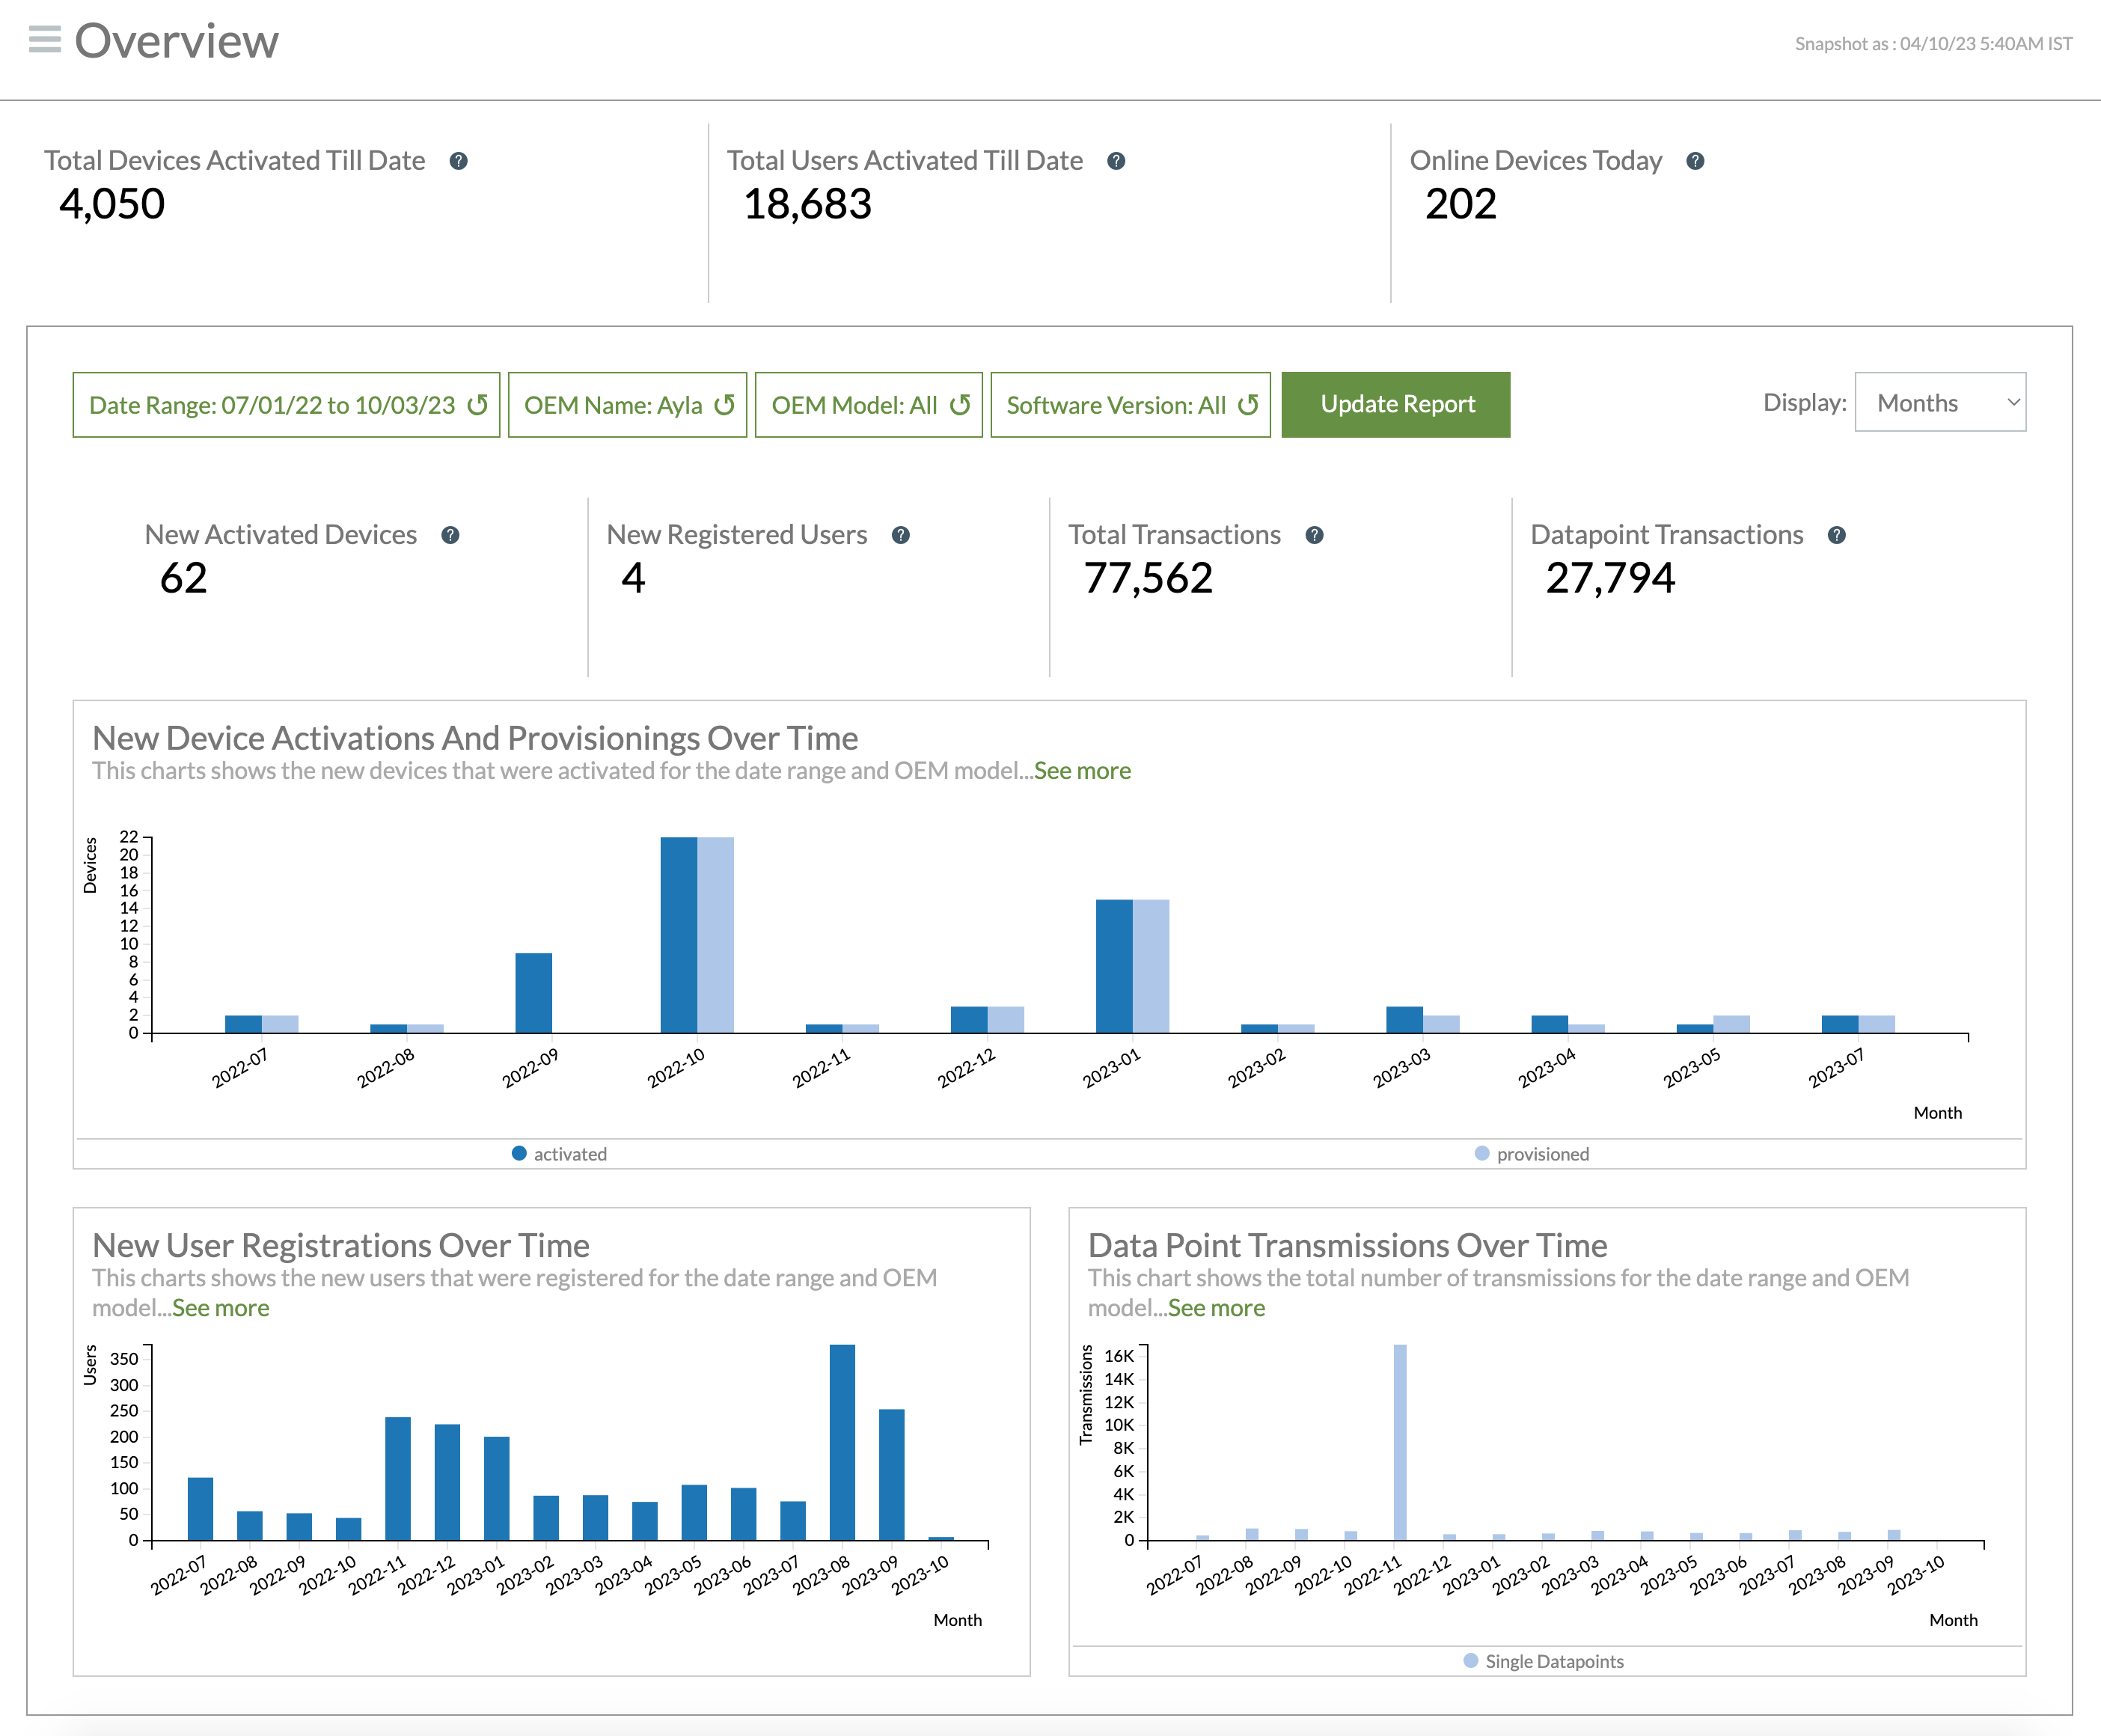
The Overview Reports provide a high-level synopsis of device and user metrics. They provide the following types of information:
- The total number of devices activated till date, total users activated till date, and number of devices active today.
- The total number of newly activated devices, newly registered users, number of total transactions, and datapoint transactions during a specific time period, which you can view in weeks, months, or years.
- A chart depicting number of device activations and provisions over time based on the date range and OEM model selected.
- A chart depicting number of newly registered users over time based on the date range and OEM model selected.
- A chart depicting number of newly registered users over time based on the date range and OEM model selected.
Refer to the following example:
The Onboarding Analysis Report
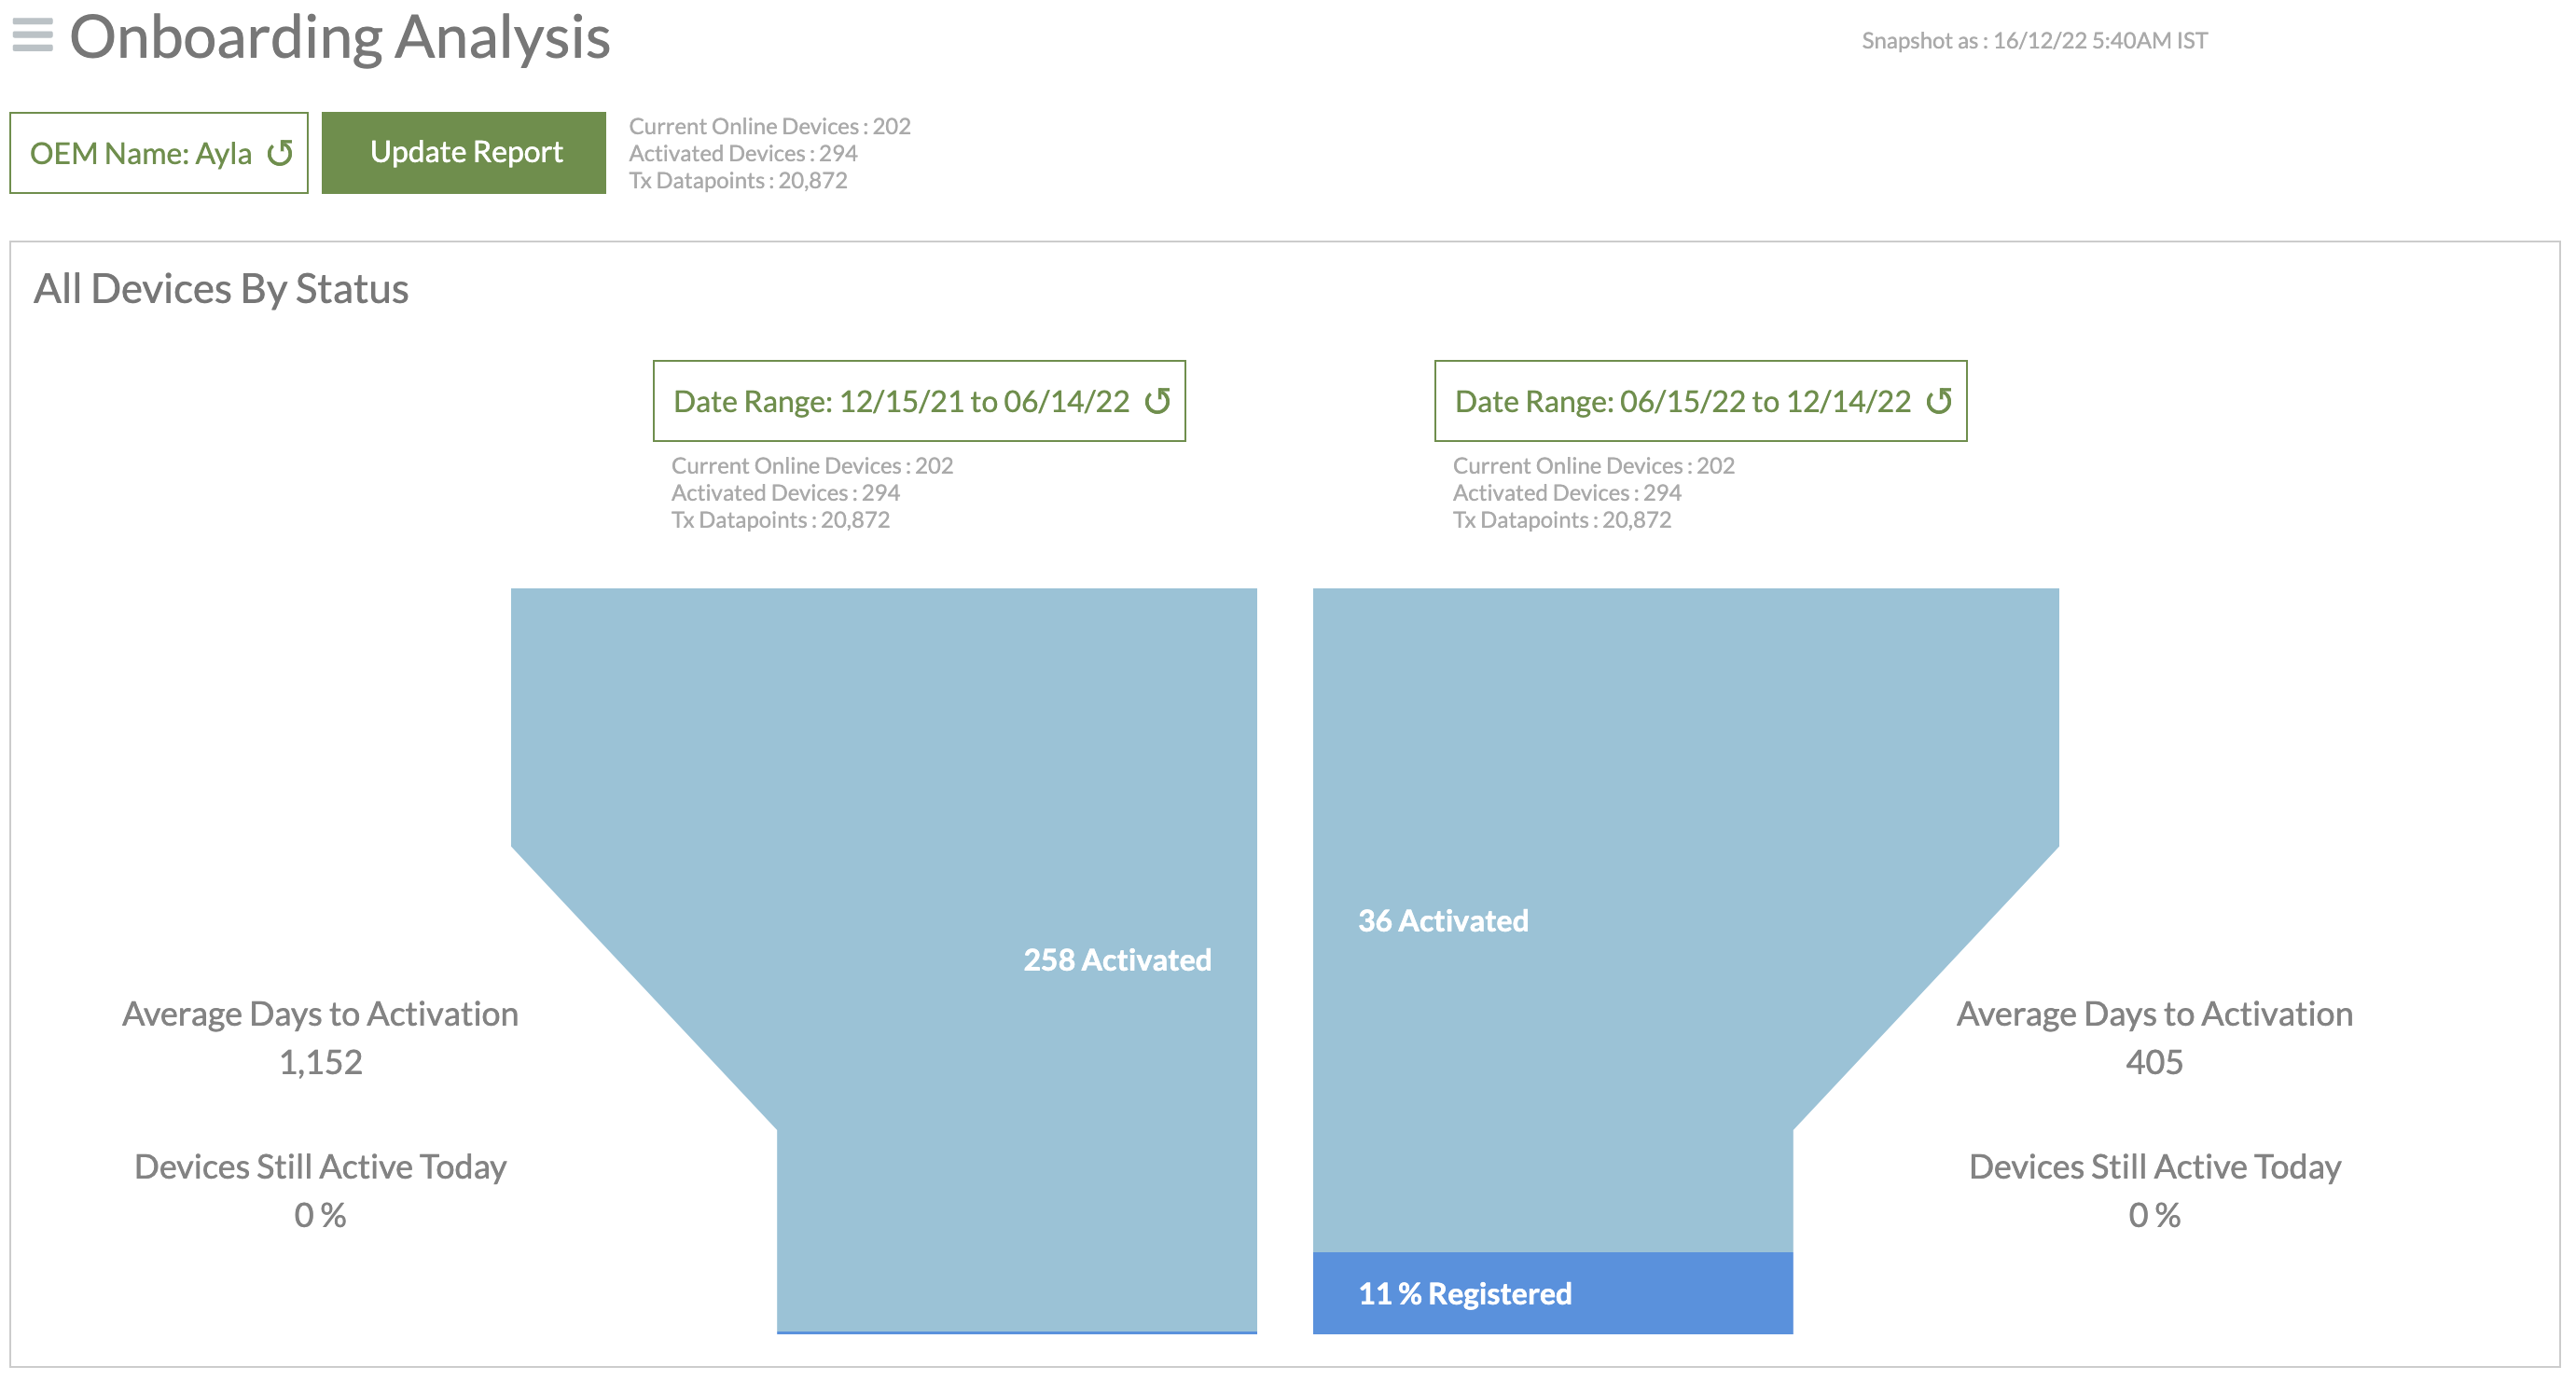
This advanced report provides a comparison of activated and registered devices for two different date ranges that you specify in the filters. As shown in the example below, on each side of the report (depicted as a funnel):
- The upper portion of the report provides the number of activated devices per the specific date range (displayed at the top of the funnel).
- The bottom of the report shows the percentage of the activated devices that were registered during the same date range.
By default, the right side shows device activations and the percentage of those devices registered for the past 6 months from the current date, and the left side shows the same information for a 6-month range prior to the date range on the right side.
Both sides of the report provide the following data:
- Average number of days to activate and register devices. This information can tell OEMs, for example, how well they are doing in terms of devices being activated and registered.
- Percentage of devices still active today. This indicates whether the devices are still being used or not.
Refer to the following example:
The Device Trends Reports
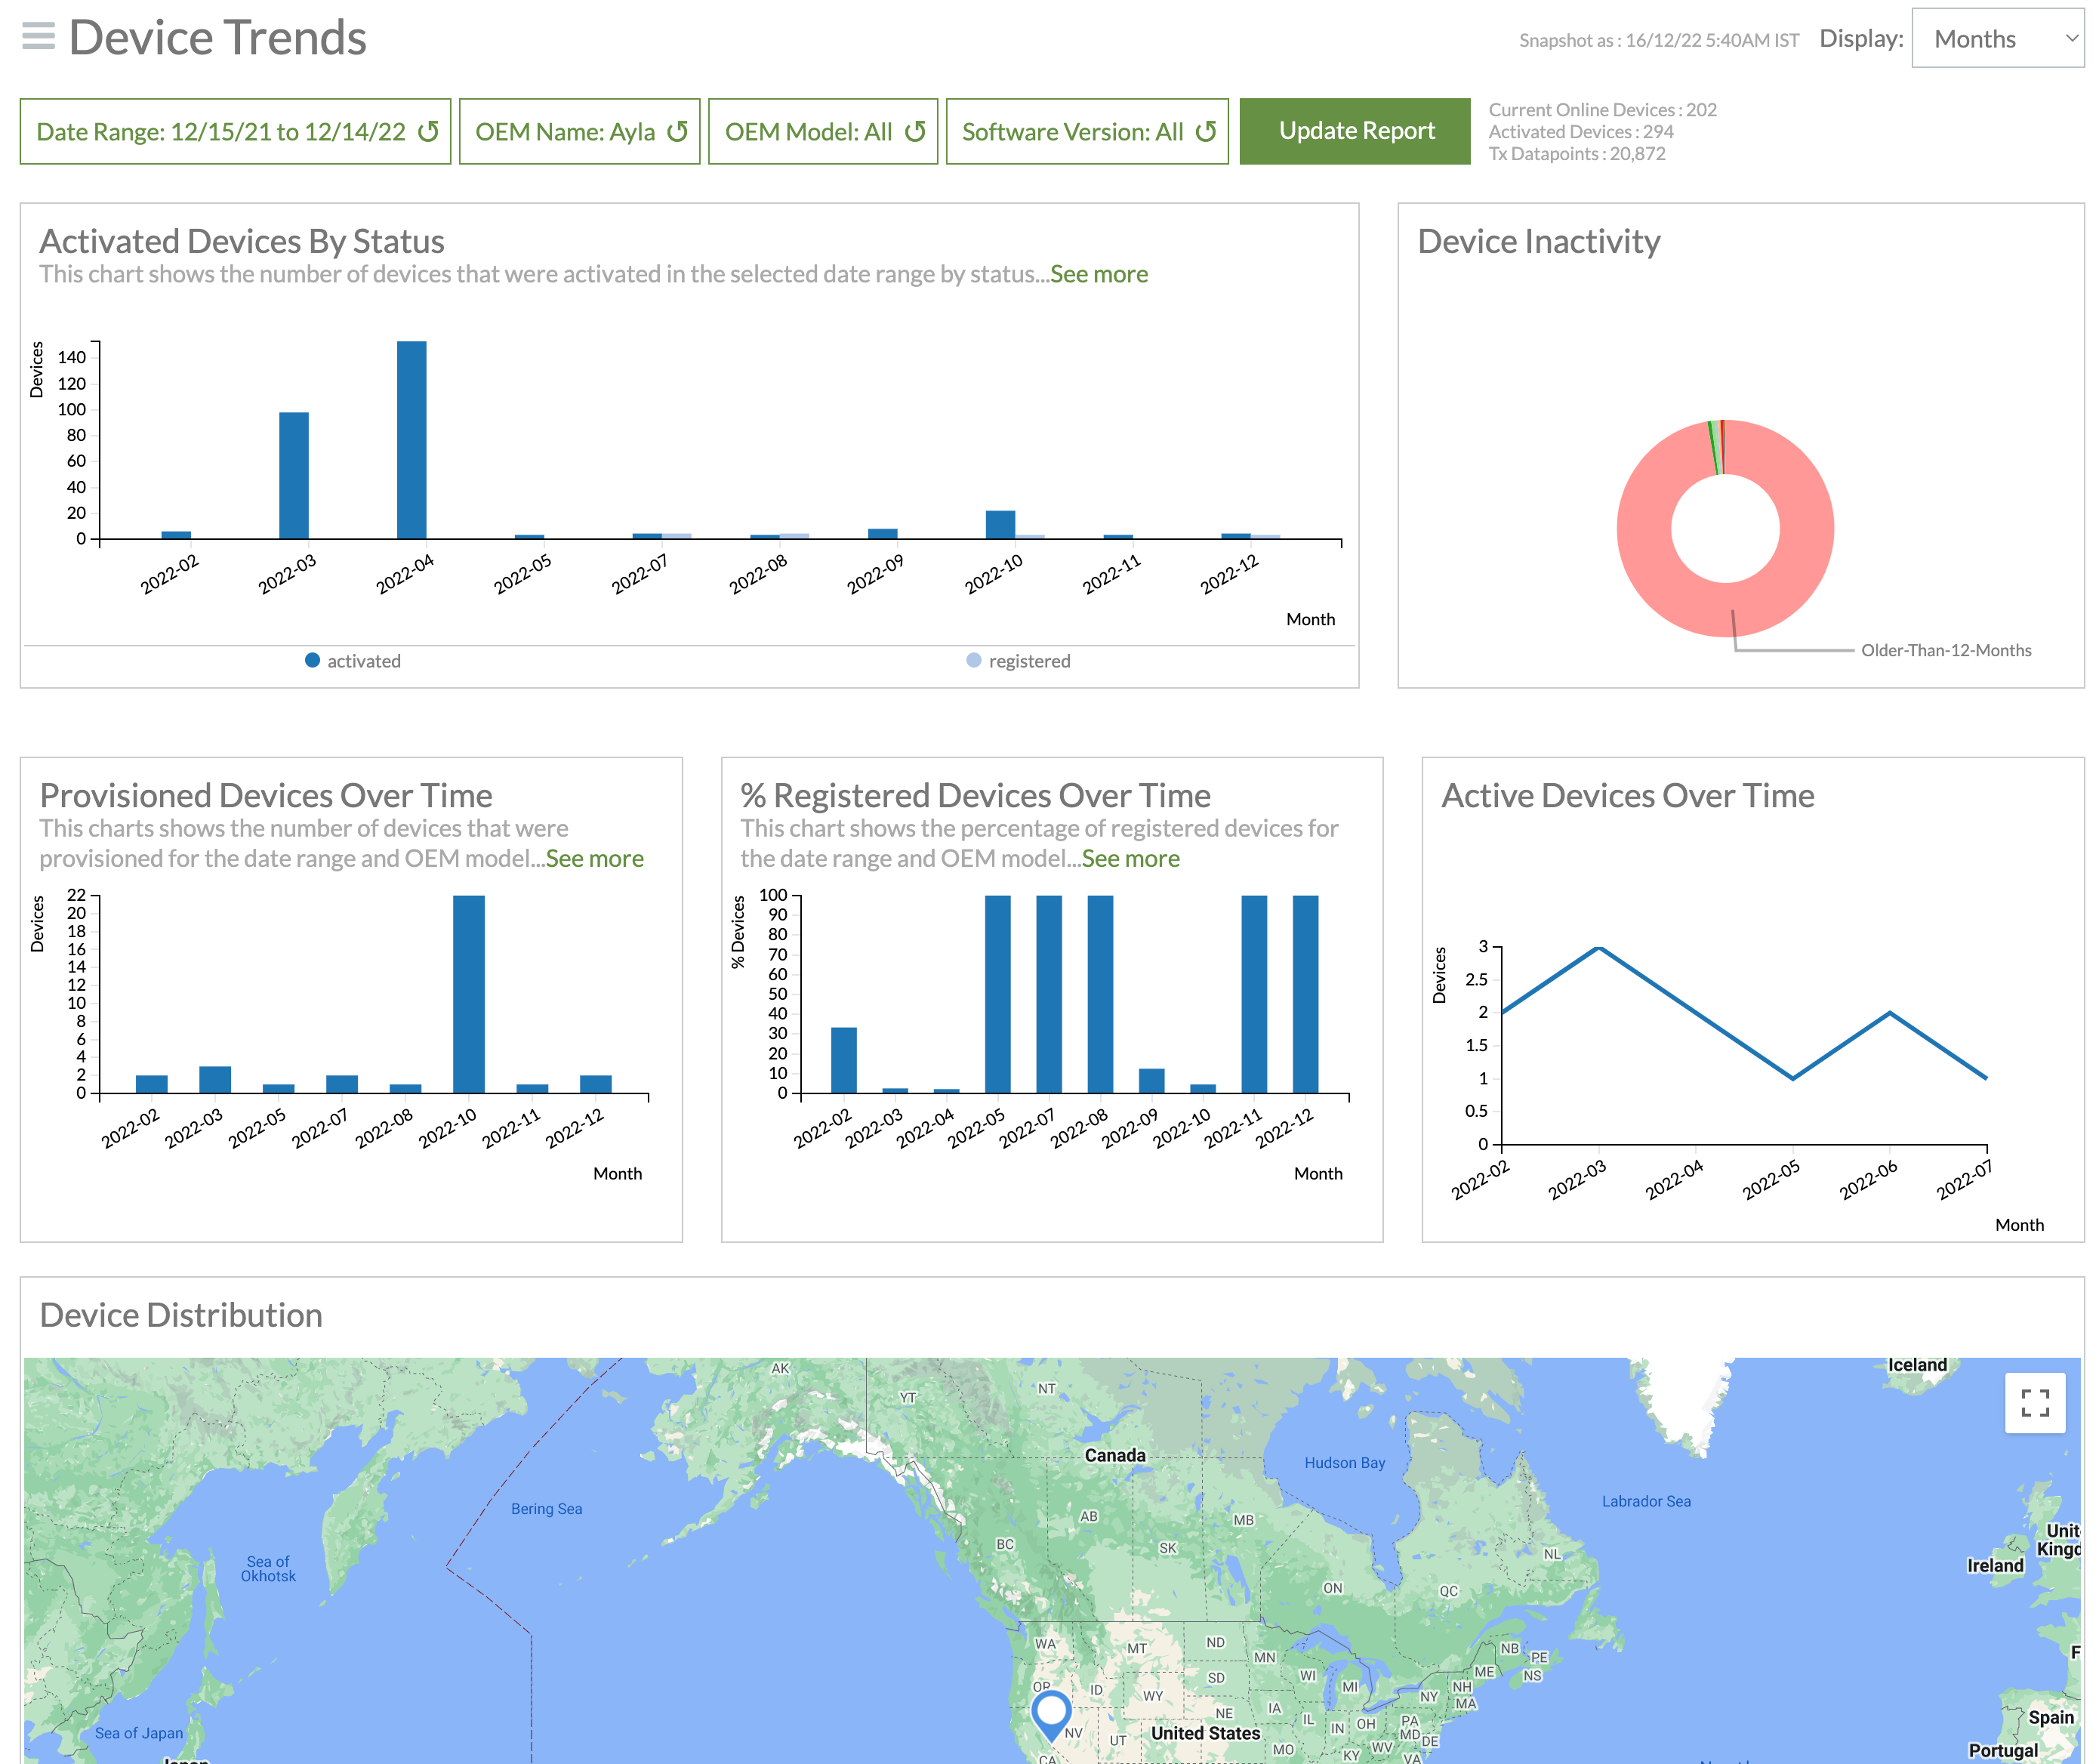
The Device Trends reports (shown below) enable you to monitor device trends over a specific time frame for the following:
- Connected status of devices
- The number of provisioned devices
- Percentage of registered devices
- Activity/inactivity of devices over time
- Offline events
- Distribution (and location) of online and offline devices
Refer to the following example:
The Device Software Analysis Reports
The Device Software Analysis reports (shown below) provide data related to the Module and Host software versions. Manufacturers can use this information to determine the number of devices, users, and software versions their devices support.

The Device Transmission Analysis Reports
The Device Transmission Analysis reports (shown below) provide data on the average number of daily transmissions of datapoints from devices to the Ayla Cloud. The reports show registered and unregistered devices so that you can monitor whether registered devices display a higher level of utilization or not.
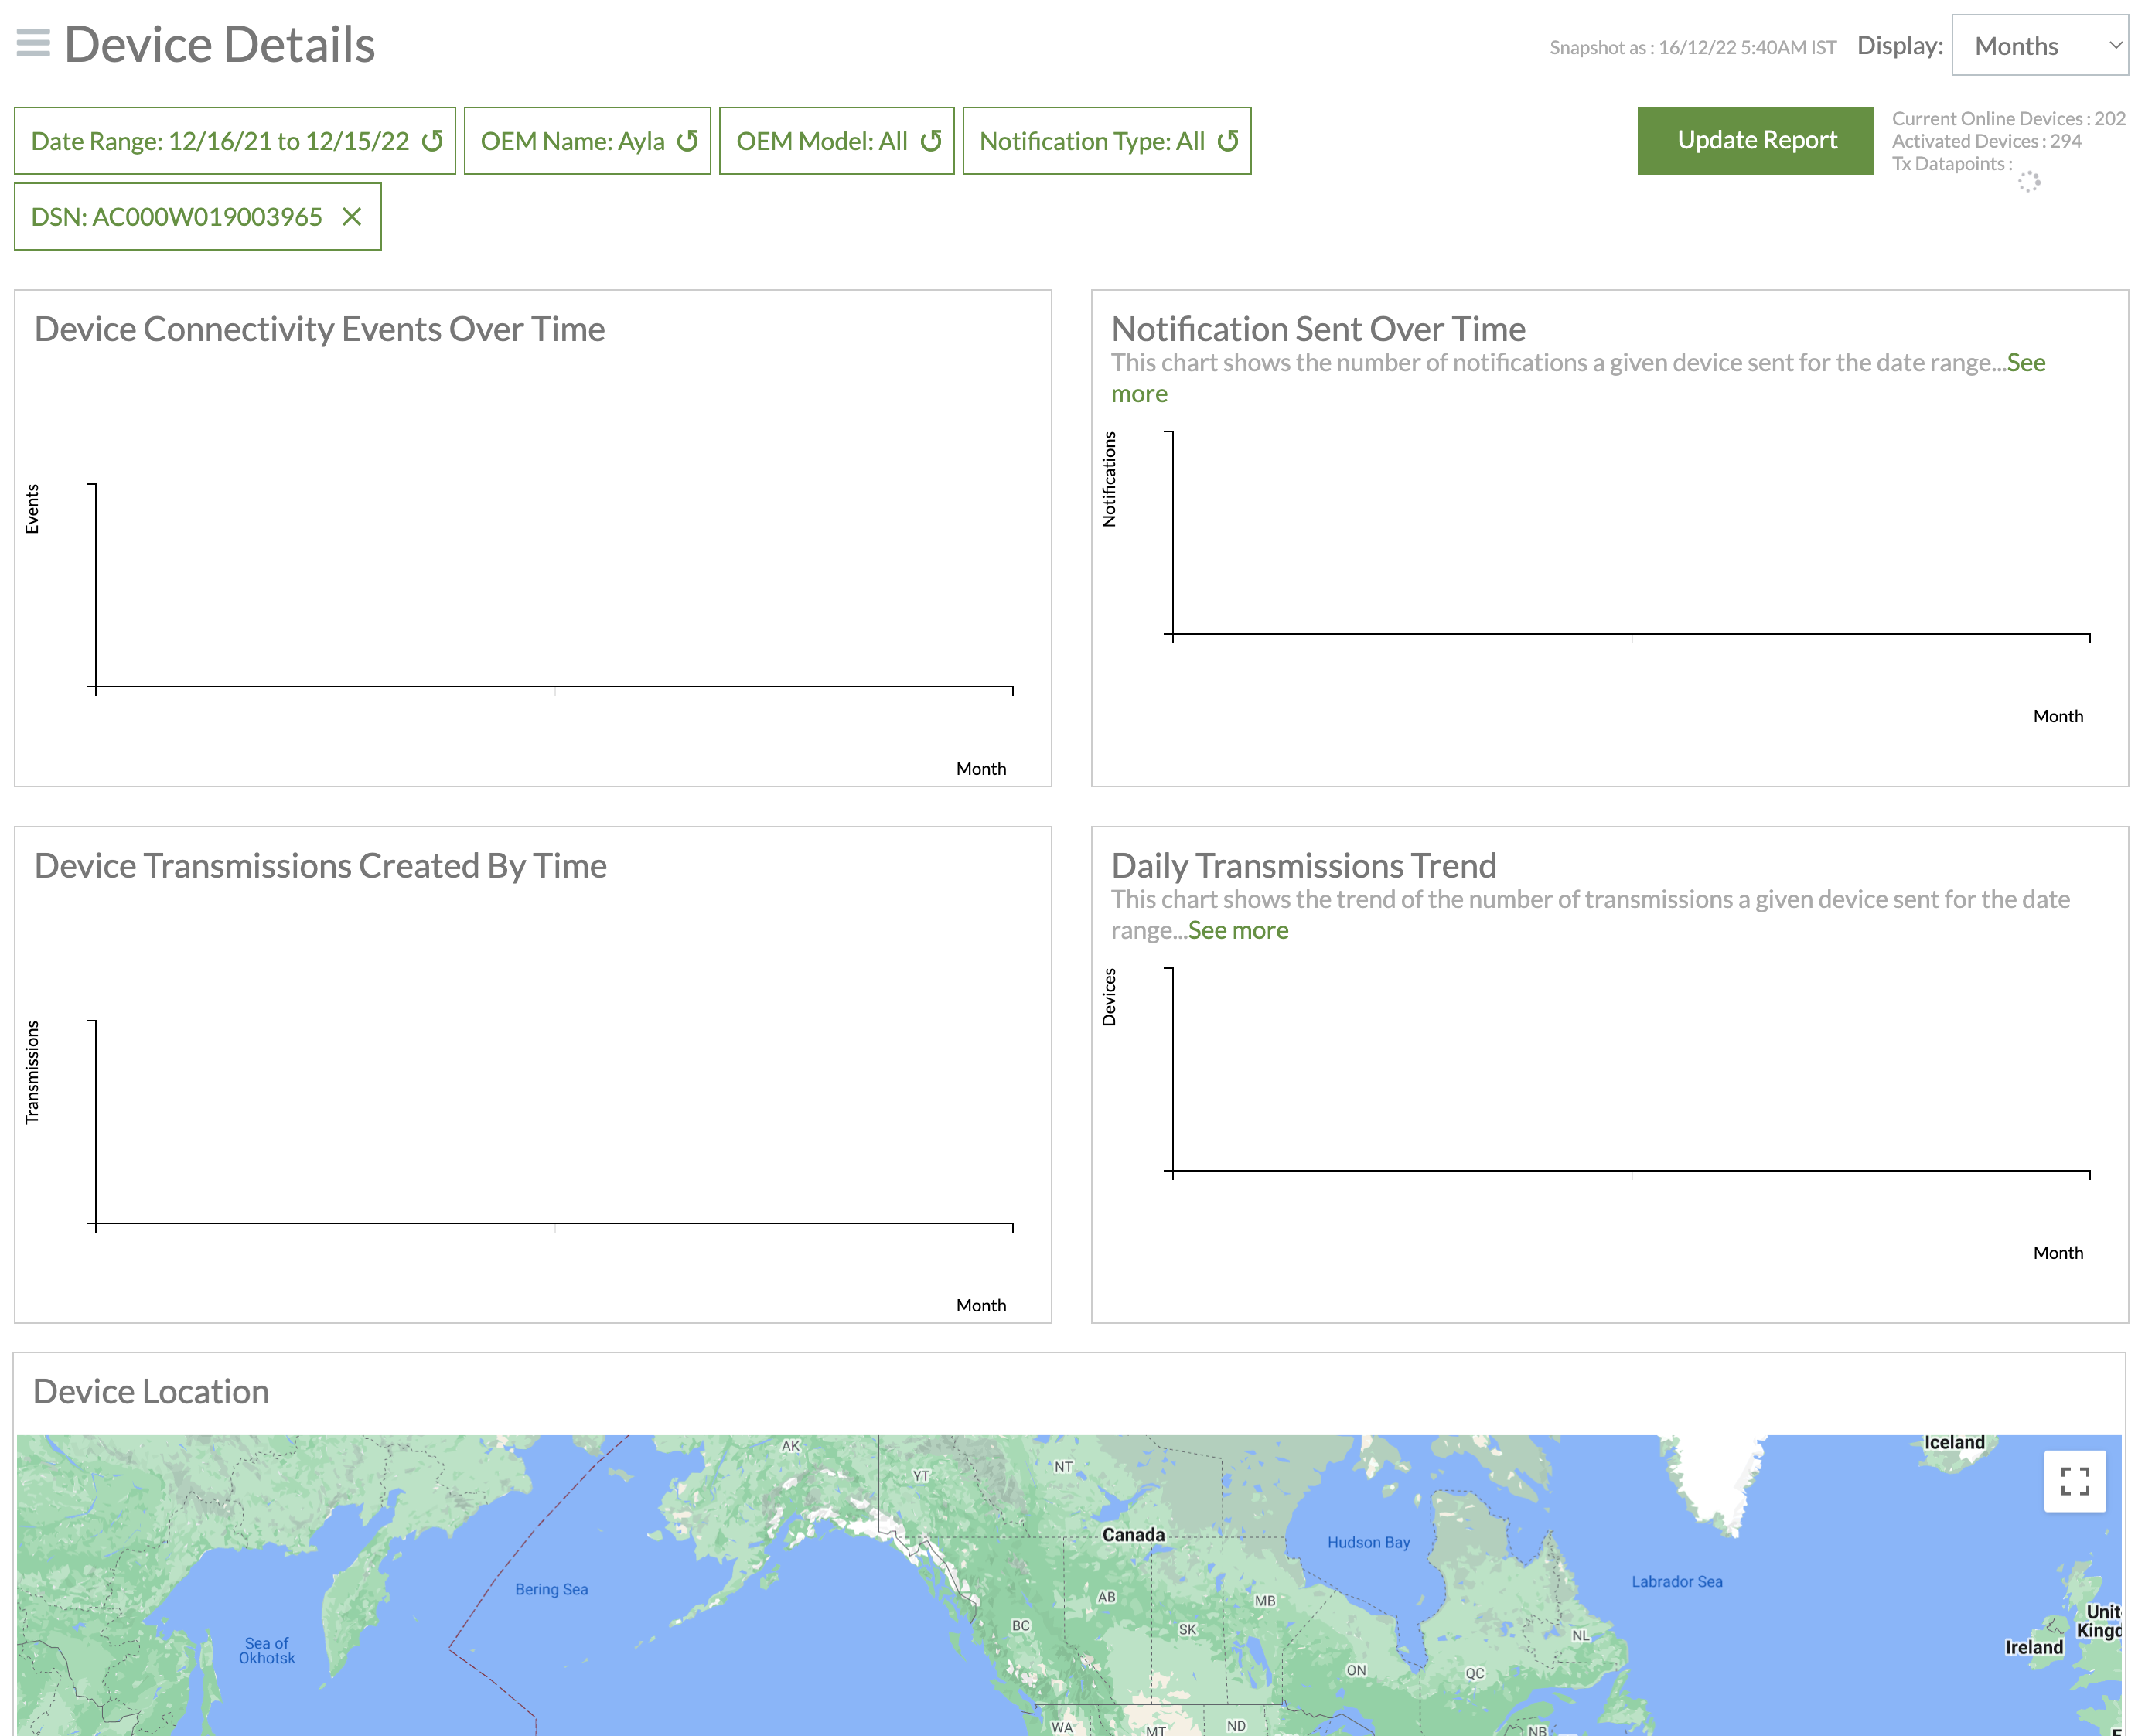
The Device Details Reports
The Device Details reports enable you to drill down to a specific device to gain insights on the following:
- When the device was connected and when it was offline
- How often the device sent notifications
- How many transmissions the device sent over specific time periods
- Where the device is located (approximated to the locality by zip code)
Before the Device Details reports open, the Filter: DSN dialog box displays (shown below) so that you can specify the Device Serial Number (DSN) of the device you wish to analyze. For more information on filters, refer to the Using Insight Report Filters section.
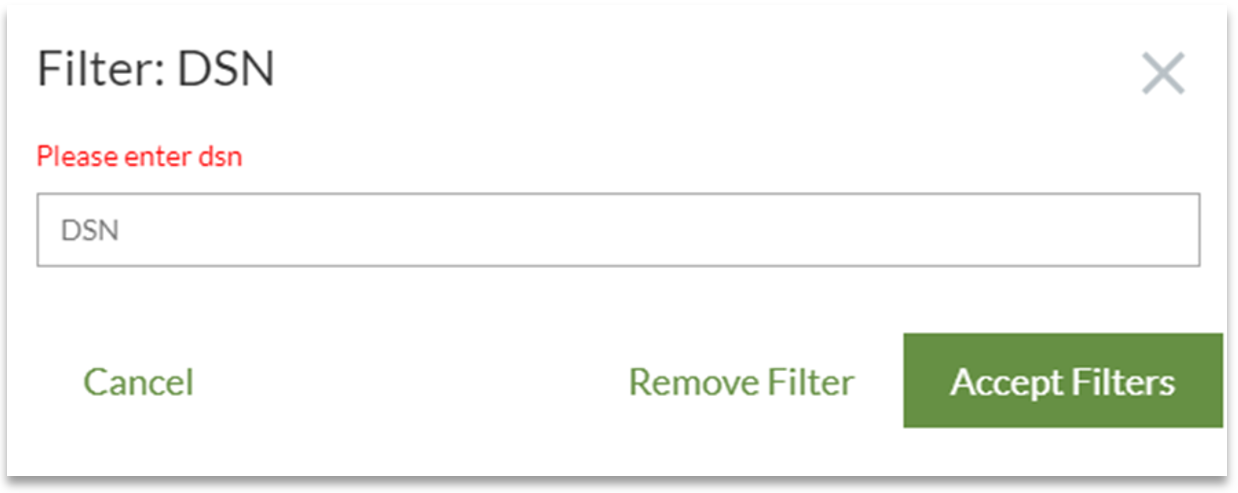
Refer to the following example of the Device Details reports.
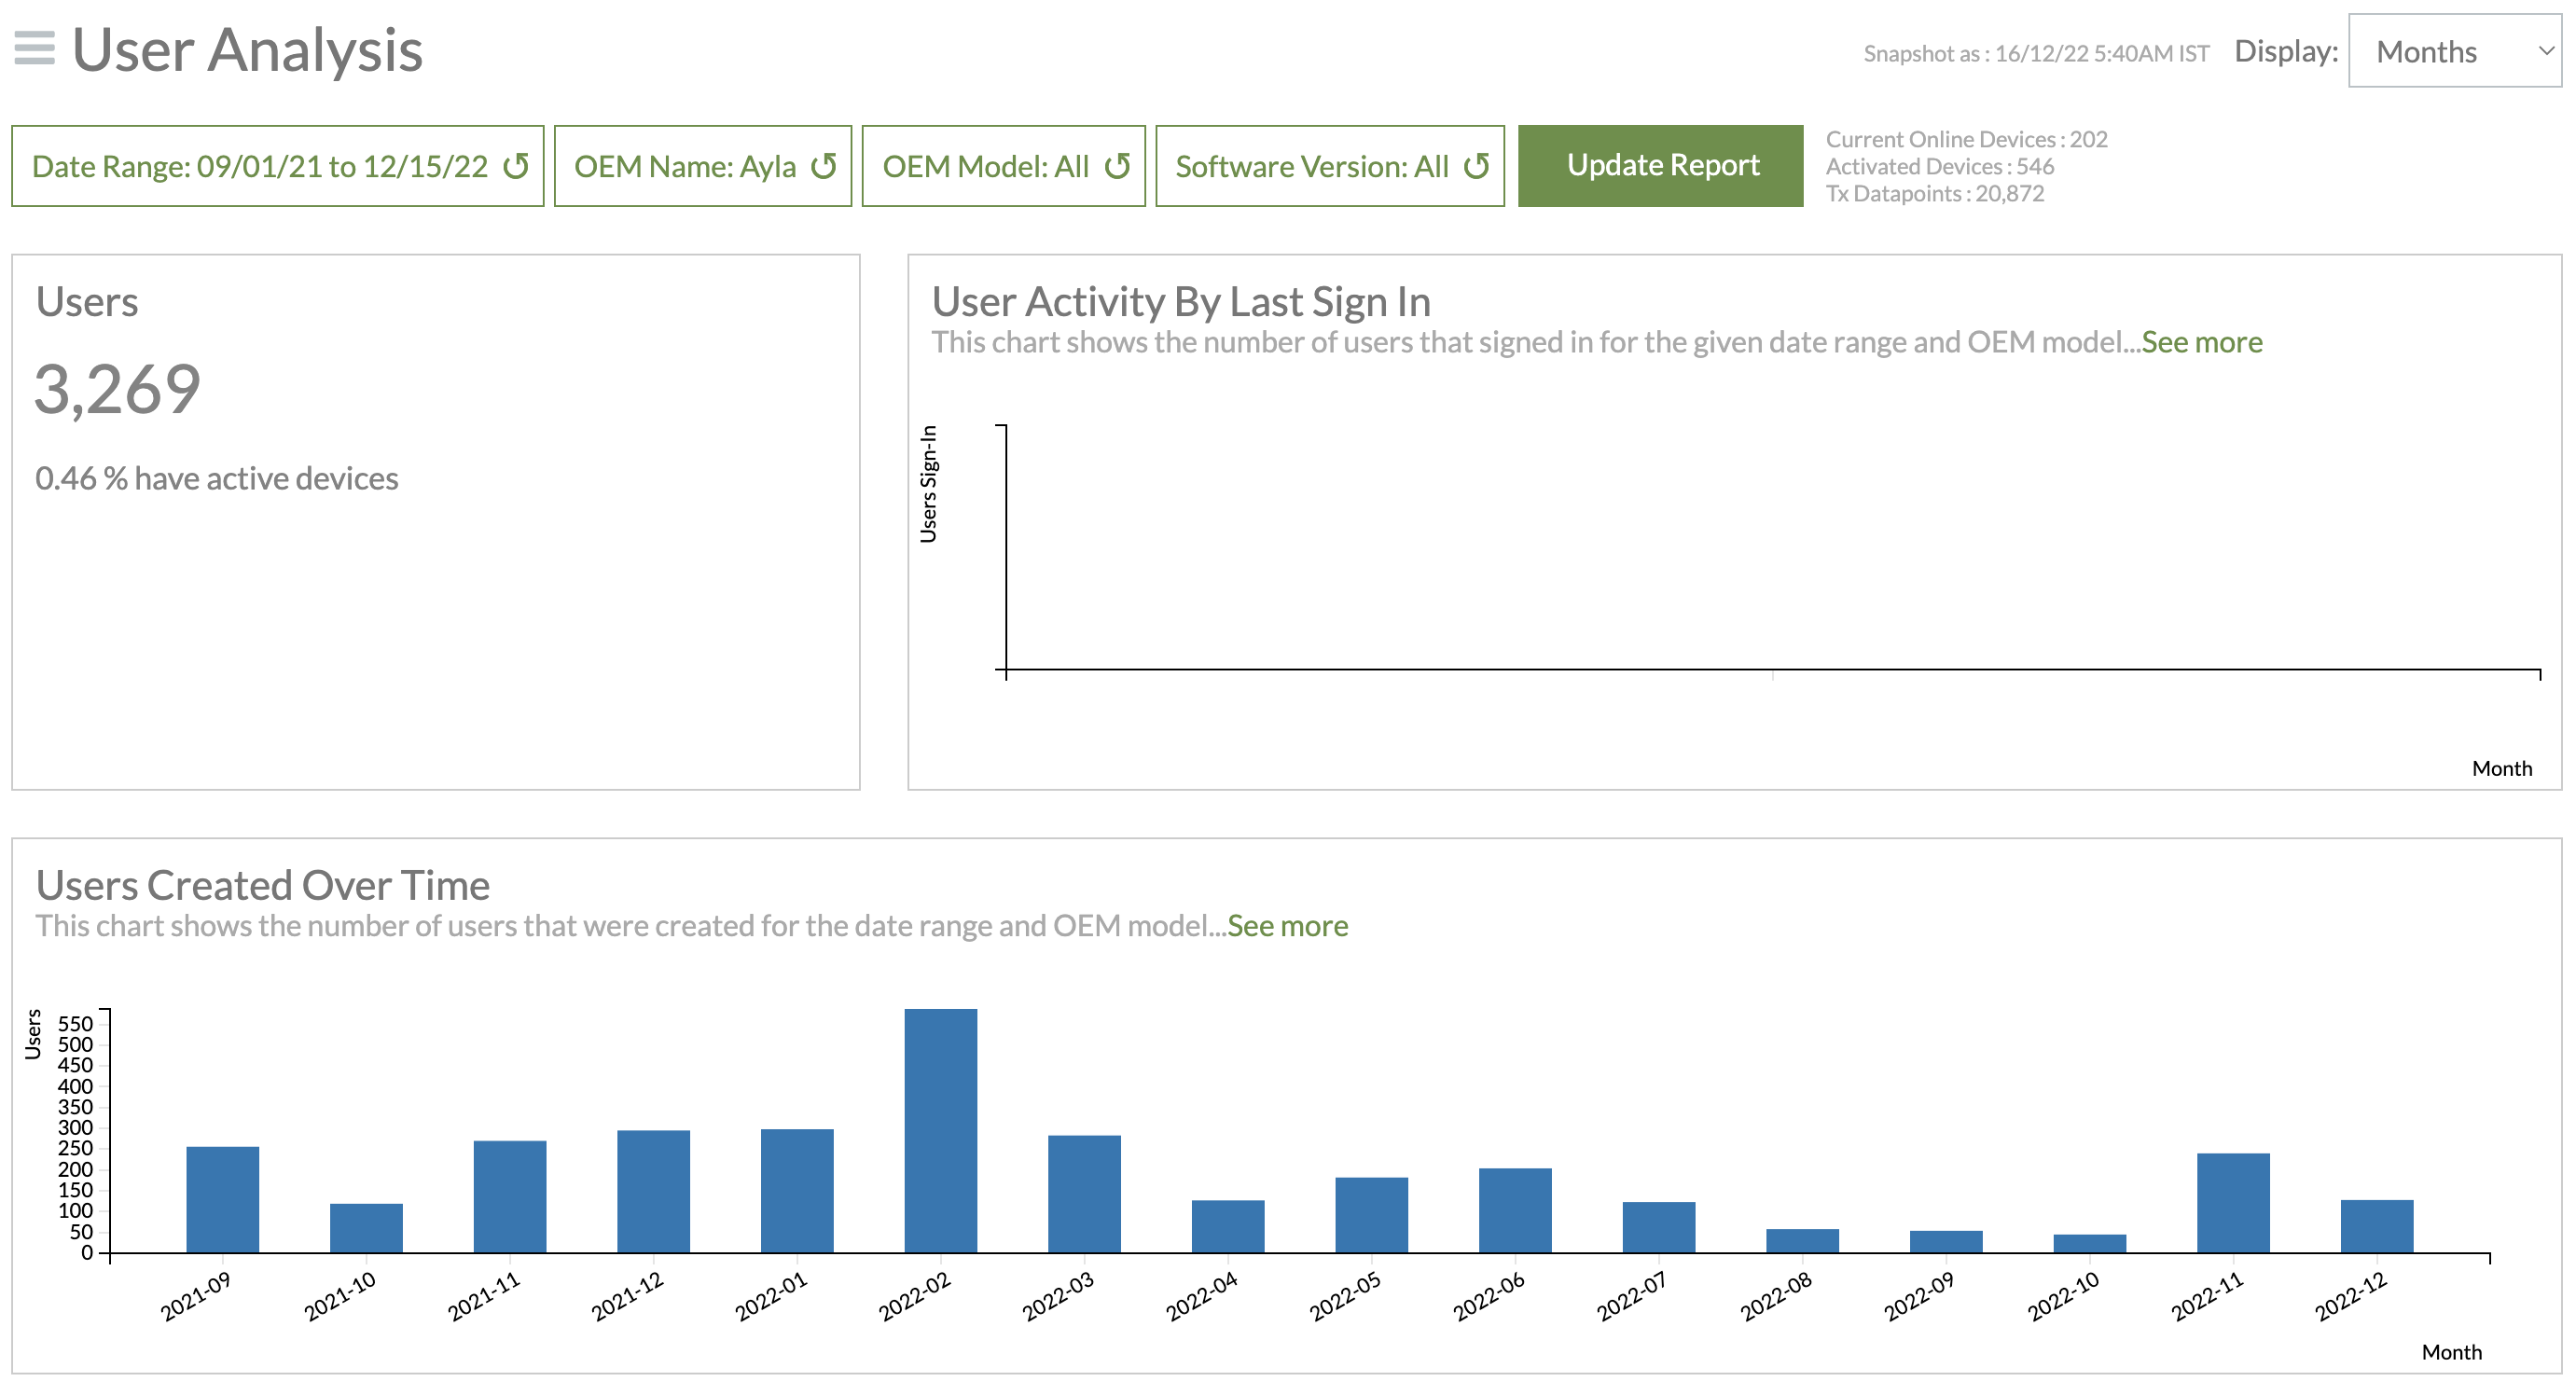
The User Analysis Reports
The User Analysis reports enable you to analyze the following data about your users:
- How many users are registered for a specific time range
- The percentage of active devices for your total number of users
- How often your users are signed in
- How many users created accounts over a specific time period
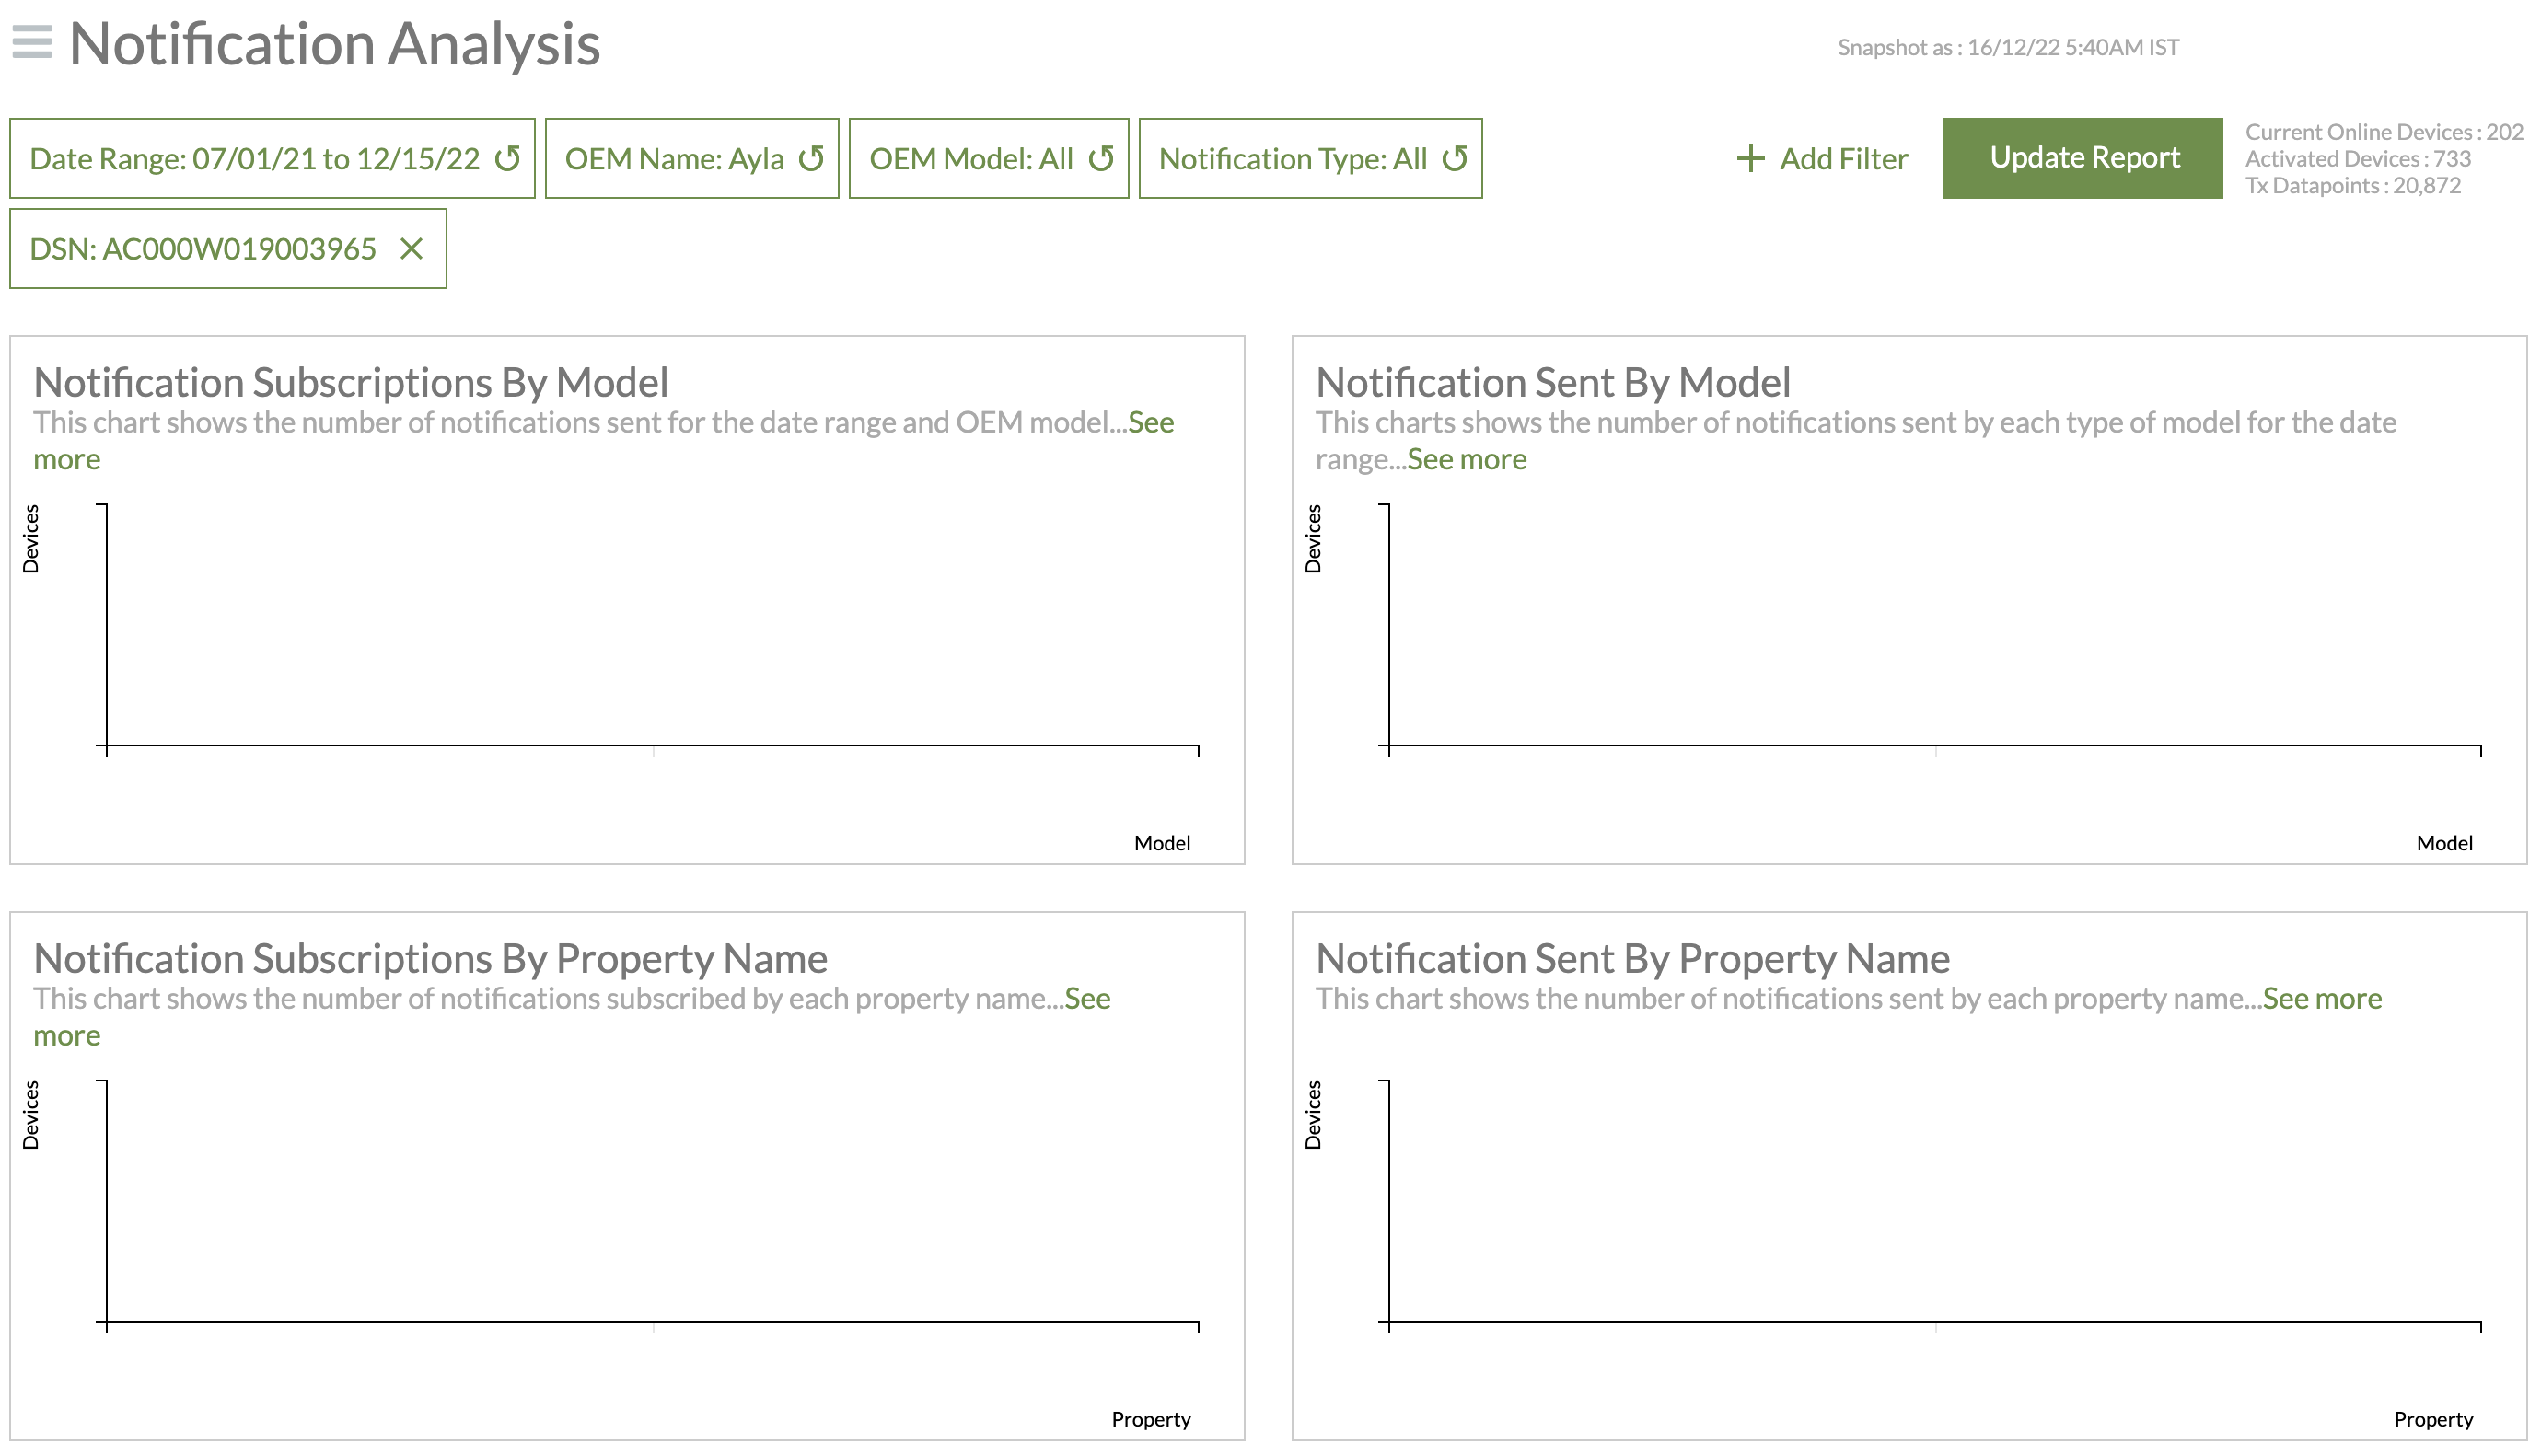
The Notification Analysis Reports
The Notification Analysis reports enable you to analyze the types of notifications used and how often, for example:
- The notifications that are subscribed or sent from the cloud for each OEM model
- The notifications either subscribed to or sent by device properties
The Datapoint Transmission Trend Reports
The Datapoint Transmission Trend reports enable you to analyze the trends for data transmissions. A transmission is when a device sends one or more property values to the cloud. There are additional filters you can use in these reports. Refer to the Using Insight Report Filters section.
Updated about 1 year ago